EcoLyfe
Changing One Footprint at a Time
EcoLyfe
Changing One Footprint at a Time
Project Overview
Ecolyfe is a personal Carbon Footprint tracker that was developed for my Master's degree Capstone Project. I worked with two other women to research, design and evaluate a mobile application that can track a person's daily activity and calucate their carbon footprint. Our project was driven by the effects of global warming and an individual's impact on the environment.
The effects of global warming and its validity have been heavily debated for a years. While there are people who believe that global warming is a hoax, a recent Gallup survey (2017) found that Americans’ concern about Global Warming is at its highest of the last three decades. EcoLyfe stives to enlighten people about the effects of global warming. EcoLyfe incorporates community participation, friendly competition, personal goal setting and social incentives to encourage people to track their carbon footprint and increase awareness and reduce their carbon emissions.
Throughout the project, we aimed to answer the following four research questions:
- Are people interested in tracking their Carbon Footprint?
- Are people willing to change their lifestyles to reduce their Carbon Footprint?
- What contributing factors do people want to track?
- Is lab testing more effective than synchronous remote testing?
My Role
Each team member was actively involved with every step of the process. I conducted user and competitve research, built interactive lo-fi and hi-fi prototypes and designed the overall aesthetic of the application.
Tools
- Qualtric Survey
- OptimalSort
- Axure
- Adobe Photoshop
- Adobe Illustrator
- Adobe InDesign
The Process
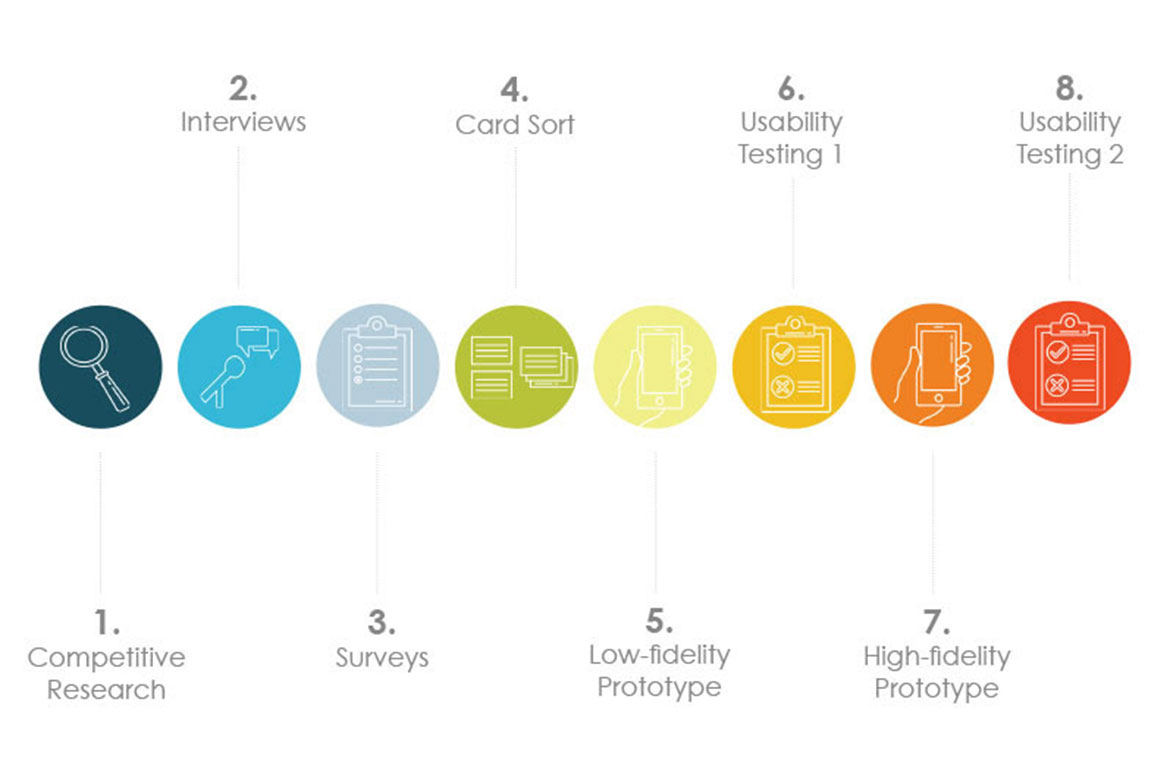
EcoLyfe was created through the iterative User-Centered Design Process. Our team took the following steps to research, design, build and evaluate EcoLyfe.
The Pre-Design Phase
The Pre-Design phase of the EcoLyfe project consisted of competitive research, user research and a modifed closed card sort.
Research
The research methods our team used provided insights into what is currently on the market, how people feel about climate change, their knowledge of their carbon footprint and their willingness to change their lifestyles to reduce their impact.
Competitive Analysis Findings
- Carbon footprint tracking applications have not reached the mainstream users
- There are currently online carbon footprint calculators and a few mobile applications
- Many of the current trackers rely heavily on manual data entry
Interview Findings
- All participants were familiar with concept of their carbon footprint but none actively tracking it
- Most participants were interested in tracking carbon footprint
- There were feelings of guilt about their carbon footprint
- Participants were motivated by self performance or social competition
- Most participants reported desiring more knowledge about where to begin
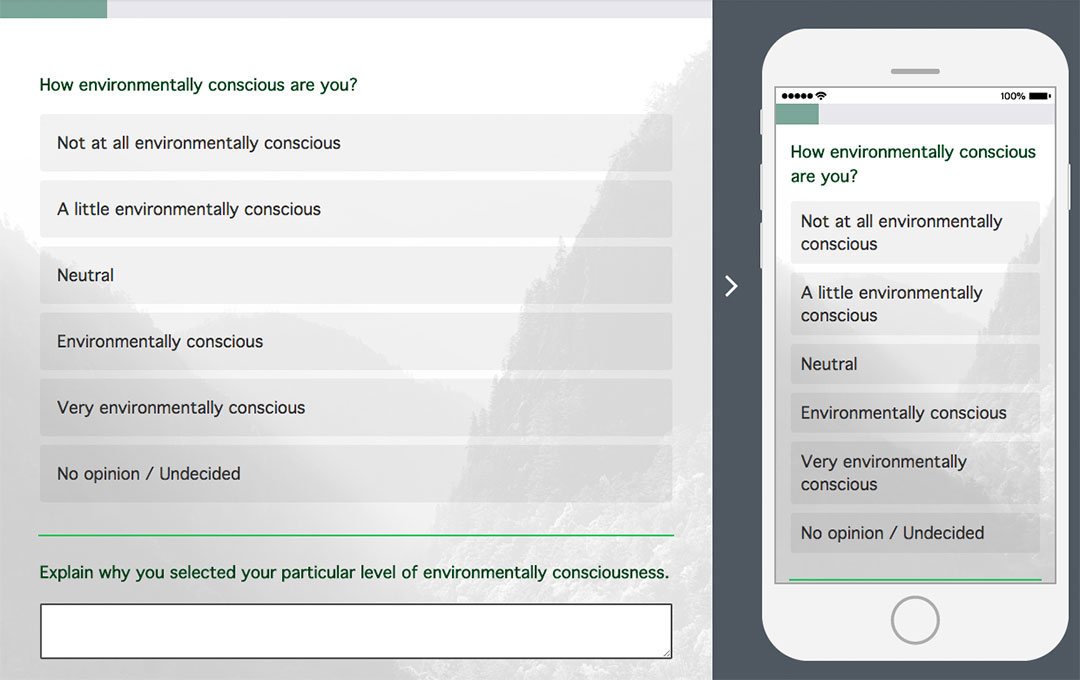
Survey Findings
- People are interested in tracking their carbon footprint, but do not know where to start
- People prefer automatic data collection
- People are willing to change their lifestyle to help reduce their carbon footprint
Modifed Closed Card Sort
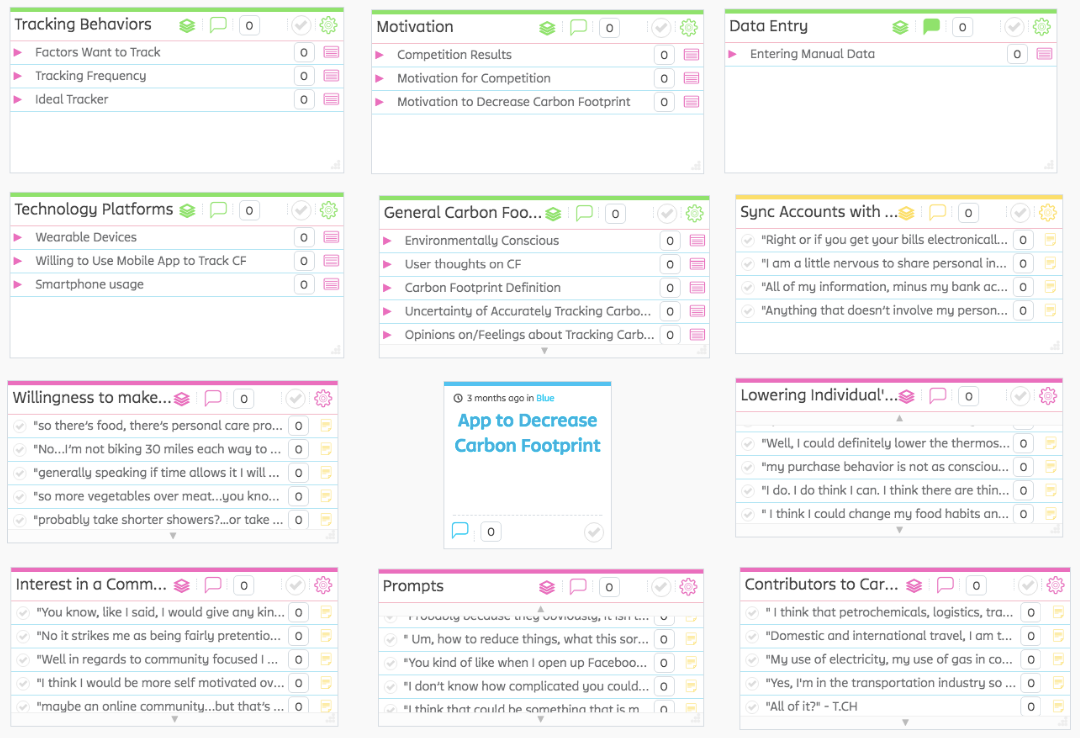
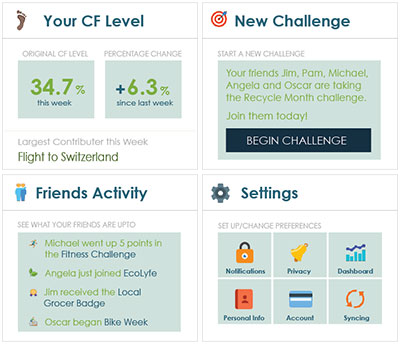
Our team created a modified closed card sort that focused on participatory design. We provided participants with 8 “dashboard slots” in which they could place 1 of 28 contributing factor cards. The first "dashboard slot" represented their highest priority and the eight "dashboard spot" represented their lowest priority. Our card sort was used to generate insights into our users’ interest in the varying contributing factors and their dashboard preferences. The dashboard card sort resulted in prioritization of the contributing factors for an individual’s carbon footprint.
Findings
- Results varied greatly from participant to participant
- People had varying interests
- There were four cards that were placed in the top positions most often:
- Percentage Increase/Decrease
- Start a New Challenge
- Friends Activity
- Settings
Design Implications
- Allow people to create their own personalized dashboard
- Create a global navigation that included the most frequently prioritized card
The Design and Post-Design Phases
Our team went through an iterative process during which we designed a low fideltiy prototype, conducted usability tests and then created a high fidelity prototype for a second round of testing.
Branding
Our team started our design phase by creating a mood board, color scheme and logo. Creating a visual aesthetic for our project early on in the design phase made it easier for us to transition from sketches to a high fidelity prototype.

Sketches
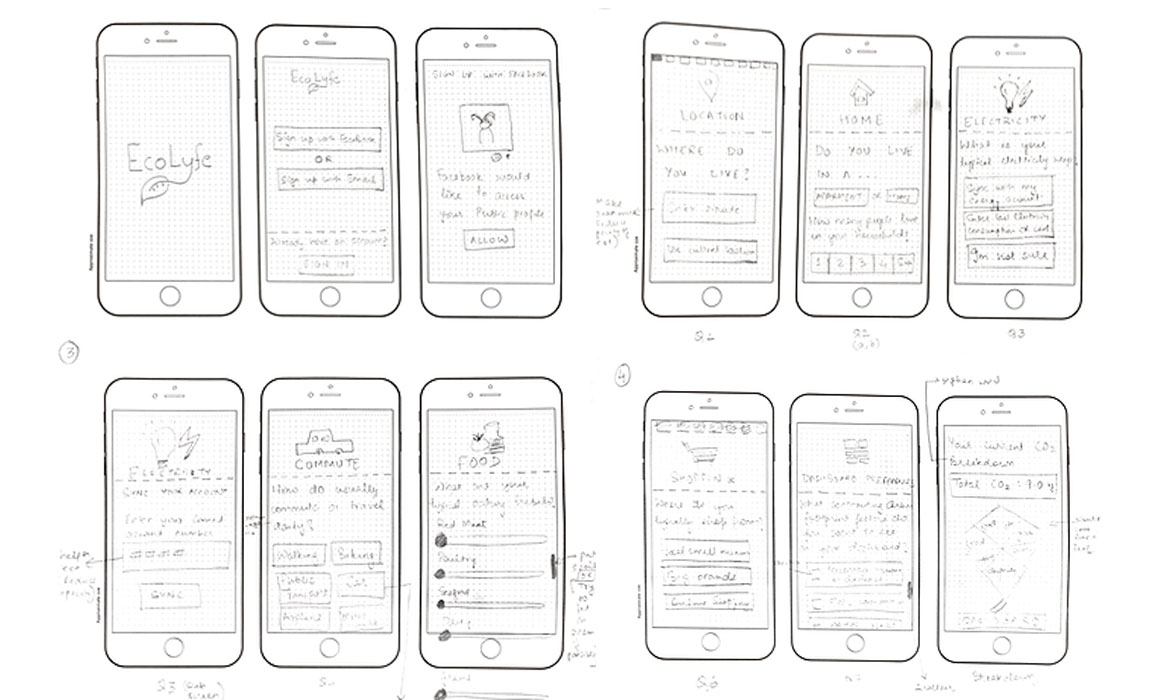
Our team focused primarily on the setup process and the dashboard interactions for our design and prototypes. First our team took the old fashioned route and started with paper and pen sketches. This helped us work through the step sequence and the various functionalities.
Usability Testing Round 1 with a Low Fidelity Prototype
We transformed our sketches into a low fidelity prototype in AxureRP. For the first round of usability testing we used our low fidelity prototype and we explored the difference between in-person lab testing and synchronous remote testing. Our first round included six participants, three in-person and three remote. During the sessions we had each participant think aloud as they walked through the setup process and interacted with their dashboard.
Findings
- Little difference between usability issues reported by the participants in-person and remote
- In-person (LAB method) resulted in better rapport
- There was confusion on what was included under the “Shopping”
- The breakdown shape was a little difficult to understand
- All participants found the setup sequence easy to follow
Usability Testing Round 2 with a High Fidelity Prototype
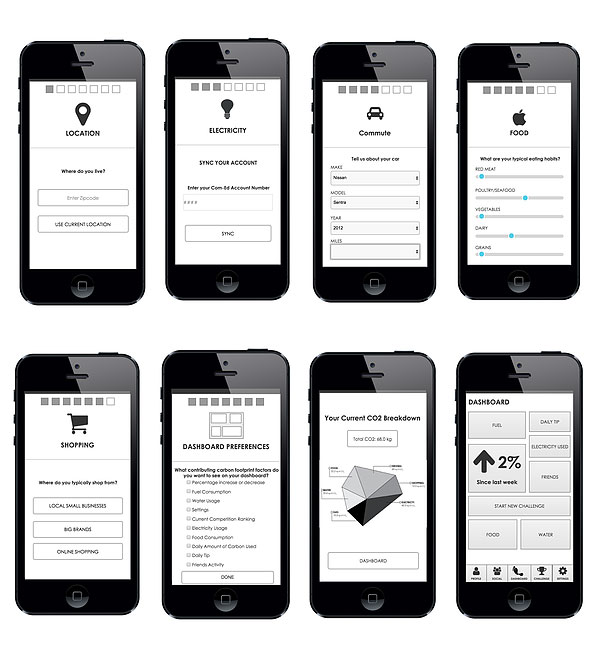
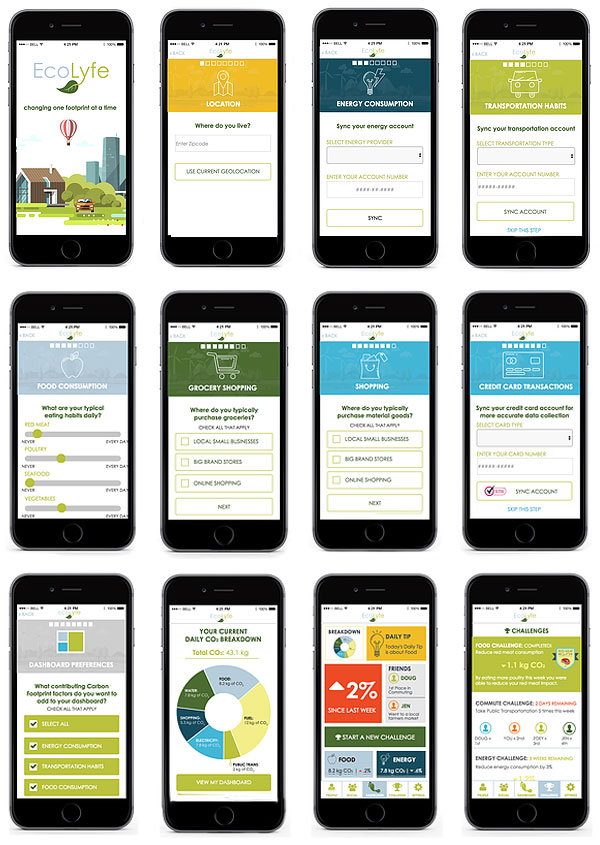
Following our initial round of usability testing we created a high fidelity prototype that addressed the issues raised during the first round. We also implemented our branding and color scheme to bring the prototype to life. Our team also expanded the number of pages included in the prototype to allow for more freedom during the setup process. The second round of testing also included six in-person testing session that focused on touchscreen interactions.
Findings
- People liked the sequence and flexible options within the setup process
- People like that we split up grocery shopping and material good shopping
- The breakdown graphic was more successful
- There were concerns about the app’s security when adding in their credit card account for automatic data generation
- There were accessibility concerns with the font color contrast and amount of content on the dashboard.
View Our Final Presentation
The Outcome
Based on our second round of usability testing, we made adjustments to our high fidelity prototype.
Throughout the full process our team learned more and more about people’s carbon footprints. People showed us that they want to learn about climate change and make lifestyle changes to reduce their impact. I would like to continue to work on bringing EcoLyfe to the world. In future work I will explore the algorithms needed to calculate the user’s carbon footprint based on their automatically generated data and daily activities.
Overall this project was a great experience and provided me with a chance to take a an idea from the planning stages through the iterative User-Centered Design Process. Our project generated a lot of buzz with our class and our professor gave our team the following feedback:
"Outstanding report. Every aspect was professionally executed, from the actual work through the quarter through the presentation in the report. This is easily the best final report I have received in HCI 594 in all the years I've been teaching it. It was a pleasure reading through it and grading it. This will make an exceptional addition to all of your portfolios. Thank you for making grading rewarding!" - Professor's Comments

